
Starting with version of Savision Live Maps version 8.5 they added a new feature called Service Health Index.
Let us investigate what it does.
Those who have been using Live Maps the last few years know about the Services monitoring, which basically is a definition of a single application/service/distributed app which gets split up in 3 parts: Infrastructure, Application and User. We place items like Operating System and Disks in the infrastructure part, we can place specific server roles like Web Server, Domain Controller and monitored items such as website, database, windows service in the Application layer. The user checks go in the User side. This way we can display the state of the Service as a whole, but also its main parts and the effect the users might see.
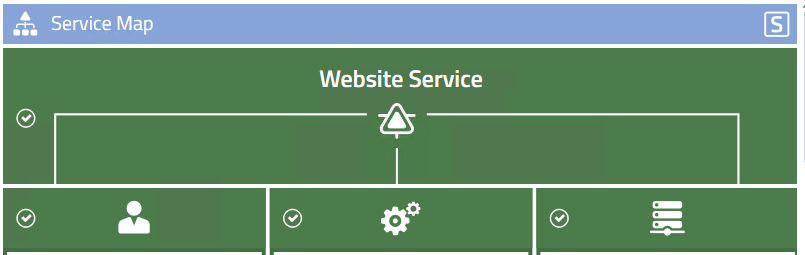
However if one of the items of one of the 3 main maps goes red this usually makes that map and the whole service go red as well. Things can be overridden with custom health rollups, but still there are the usual Green-Yellow-Red colors and the rollup to the top. There have been several requests to be able to specify which parts of our application are more important than others. For instance, imagine a web farm. Lets say this farm has 3 web servers and 1 database. Now, if 1 web server goes down this will make the application go red, but the website is still up. The user side website check would show a green state still as well, but the health rollup does not make a distinction of this and rolls up the Application map to the Service state.
Now imagine the database going down. Assuming for a second any other high availability solutions for this database have failed. Without the backend database the website will not work. This is also rolled up again to a red state for the Application side and up to the total Service health. Depending on how the user side web checks are setup this could make that check go red as well as a User impact. However, looking at both imaginary situations the Service went into a red state and we potentially did not see much difference as to how important this red state was to the service.
Bring in the new feature Service Health Index!
Quite simply we have a list of items we are monitoring in the Infrastructure/Application/User maps and we define how important they are to the working of the Service on a scale from 1 to 5 with 5 being very bad.
What does this look like? Lets open up the Savision Live Maps Authoring Console and open up one of the Services. In this case I am opening up the SCOM service. There is now a tab called Health Index.
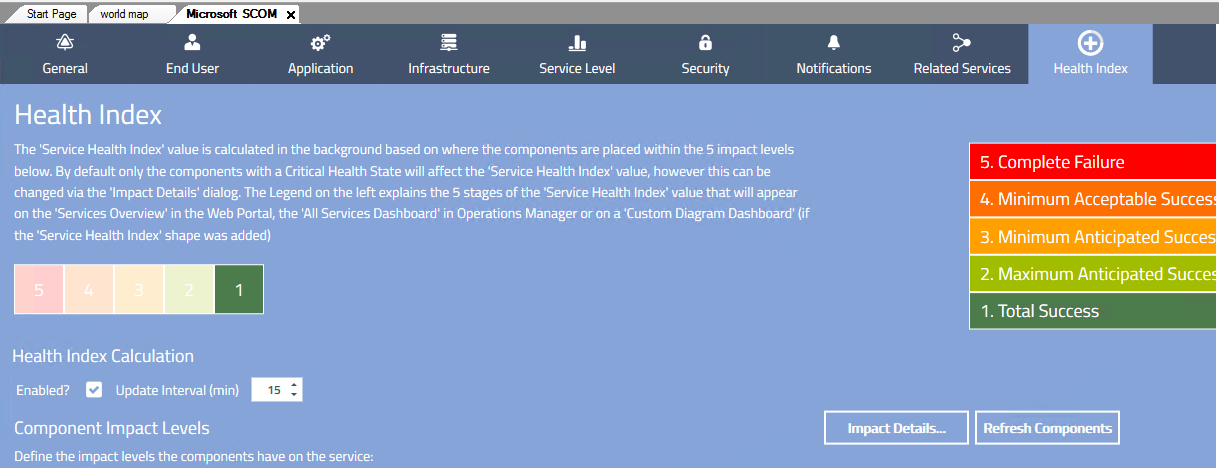
From this screen you can Enable the Health Index and set it to update its health index indication every x minutes. I set it to 15 minutes at first.
There is the option to set which states have an impact on the Health Index:
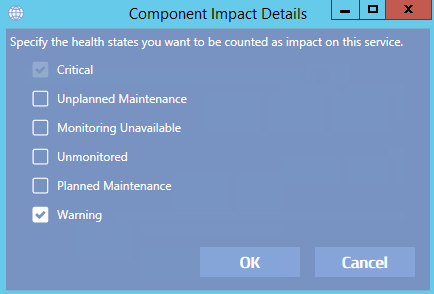
So I added Warning in this case as an example.
Next you will see a list of all current objects added to all 3 maps (Infrastructure/Application/User) which are added to one of the levels. You can now drag them around to the correct effect it would have to your Service.
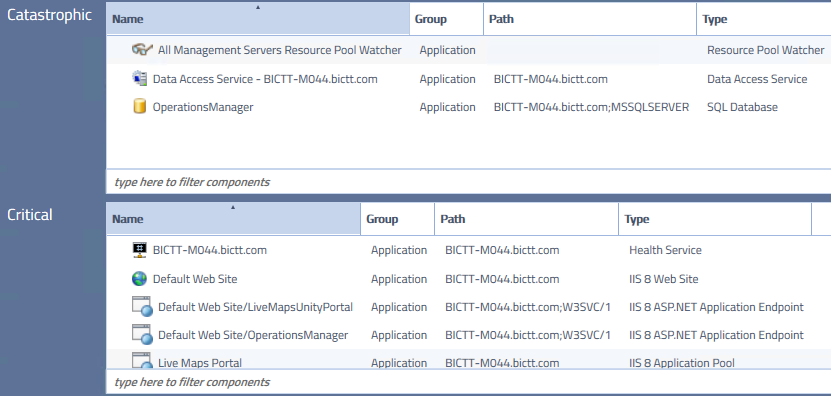
So over here I have been dragging some components of the SCOM Service up to the higher impact levels.
The SCOM operational database, the main Resource Pool and the Data Access Service in this case were placed in the Catastrophic level (level 5). Next move down and place other components according to the expected impact of those components on the working of the service.
Next Save the result. Give it the amount of minutes you specified to calculate the health index the first time.
If we now go to the All Services Dashboard we see the following:
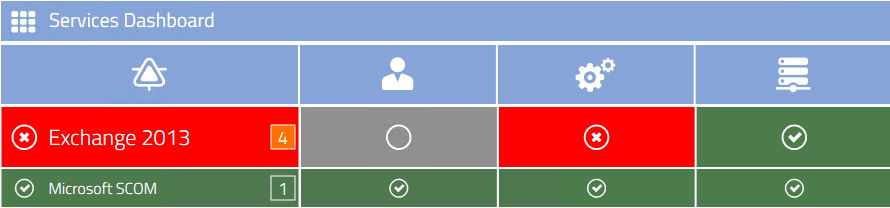
Luckily the SCOM service is still green. On the other service (Exchange) you can see the Health Index of 4, which means this red is quite red, but not catastrophic yet.
So now we have a combination of the health state rollups of the 3 main components of every Service and an additional Health Index indicating the resulting effect and priority of handling the situation!
Enjoy your monitoring and pass on the value of monitoring to the whole organization by displaying the state of company services and its impact to all stakeholders!
Bob Cornelissen