
In my previous post which introduced SCOM 2016 Features – Network Monitoring MP Generator I have shown you how to use the command syntax of the tool and why it was created. Now it is time for an example.
The idea:
Have fun monitoring some network device and see how the principles of the input XML file works.
Also because I have been doing a few presentations with a SCOMosaur theme, so we combine a little SCOM with a little dinosaur madness. You will see a few references of that here and there.
Mind I am using a simulated device which may not be fit for this purpose. Reason being the default simulated devices by the Jalasoft SNMP Device Simulator are all CERTIFIED. ANd we are of course creating monitoring for the non certified devices. :crazy: The OID’s in the example below are from a APC UPS device, but for now we can use it as exampe clearly enough.
Prerequisites
- First of all I am using SCOM 2016 TP5 here, which is the first version to include this feature.
- I am using Jalasoft SNMP Device Simulator on another machine to simulate a few network devices of different types.
- Of course make sure both sides can reach eachother with ping (ICMP) and SNMP.
- I am using iReasoning MIB Browser to browse the SNMP tree on the device selected to determine we actually have data there and the right OID’s.
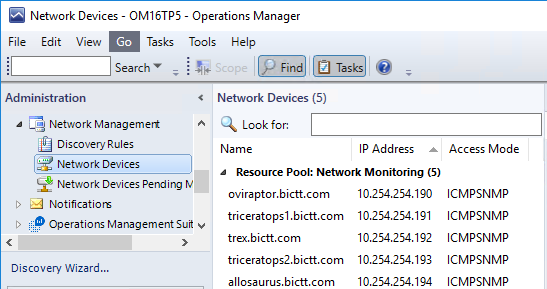
Next on the list is to discover the devices in SCOM by creating a Device Discovery and adding the device IP addresses and SNMP community string to it and letting SCOM discover the devices.
The XML input file
Actually the idea here is relatively the same as a simple management pack setup.
- A manifest with management pack name and version
- A Device definition
- A Device discovery>/li>
- Device Components
- Device ฉomponent Discovery
- Rules (these are collection rules)
- Monitors
Starting the Manifest
First we are going to define the start to the input file by the Root tag.
Next we define the Display Name and Version for the management pack.
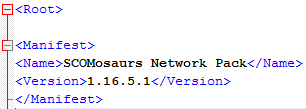
Name and Version are mandatory and an optional tag is KeyToken.
Device Definition and Discovery
The next thing to do is create an entry for each type of device and to make a device discovery for it.
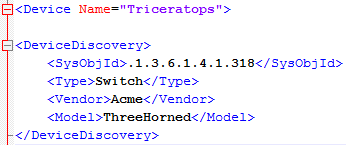
First we define a name for the device.
Next we jump into a discovery for it.
The discovery covers the SysObjId tag which points to the unique device identifier for the device type.
Next we have to specify a device type. The following types are supported for now: Switch, Router, Firewall, LoadBalancer.
Next fill out the Vendor and Model.
Components and Discovery
Now it is time to look into the components of the device. For example Processors or Fans. After we dicover those we can target monitors and rules to those components in order to monitor them.
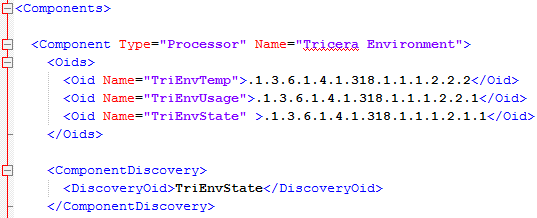
We are opening the Components tag here, and it will be closed all the way at the end of the story.
Next we define our first component.
There are a few component types supported at this moment: Processor, Memory, Fan, Voltage Sensor, Power Supply, Temperature Sensor.
And we give it a name of course.
Now we define the OIDs we are interested in. These OIDs will have to be there for each instance of the Component we define. One of these will be used in the discovery of the component and the same one and/or others we can use for rules and monitors. At least we have defined all of them here and given them original names.
We do not have to enter the index number of each component instance. For example…
fan2 = 1.3.6.1
fan2 = 1.3.6.2
fan3 = 1.3.6.3
In the very short OID example above you can see the last number is the index number for each fan. So we only need to specify 1.3.6 in this case and the discoveries will find each instance for you.
In this case I named the component the Tricera Environment and gave it a Processor type, just because it needs to conform to the default types at this moment.
The 3 used OID’s are a Temperature OID, a Usage OID (which happens to be the amount of battery percent left for the UPS), and an overal state indicator OID for this component.
For the step coming after this, it means we have two performance counters we can collect (but I will collect all three in the example), and also we can create state monitors based on the values.
Lastly the ComponentDiscovery is a pointer to which of the already defined OIDs is a component indicator. In this case I use the state indicator OID. If that one is there (with an index number behind it) an instance of the component will be created or as many as needed.
Monitoring and Rules
Alright now the monitoring needs to start for the component we are still at.
For starters we set the Monitoring tag. We will close that tag later after we have defined all rules and monitors.
Next we start with the rules:

We open the Rules tag and next define the performance collection rules as you see here. I used short names for it and pointed each rule to the name of the OID we defined already. See how easy that part is?
Lets go to the monitors now…
Monitors
First again we start it off with the Monitors tag which we will close off after the last monitor we add.
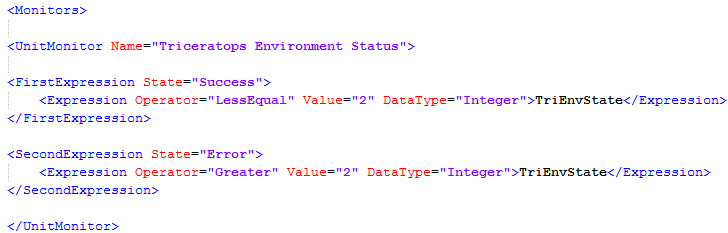
Alright, first UnitMonitor. We give it a name. In this case Triceratops Environment Status.
It is a two state monitor so we define two expressions.
Both of them point (in black letters in the middle here)
to the name of the OID containing the state indication.
The first expression is for success (green state) and uses 2 or less. And the second expression uses anything higher than 2 to set it to an error state.
So i repeated that two more times for the Temperature and set it to 30 degrees as maximum acceptable value, otherwise our dino gets sunburn. :lalala:
And the third monitor is using the TriEnvUsage OID to determine if it is at 100 or below.
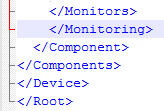
And now as promissed we close the whole load of tags off:
The conversion process
Alright we now have an XML input file with all the stuff we need. Now we need to use the Network Monitoring MP Generator tool to convert the input file to a management pack XML file.
Open a command prompt and go to
%Program Files%Microsoft System Center 2016Operations Manager
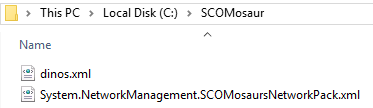
I placed my input file in the folder C:SCOMosaur with file name dino.xml and I will allow the output file to be written to that folder as well.
I run the command:
NetMonMPGenerator.exe -InputFile “C:SCOMosaurdinos.xml” -OutputDir “C:SCOMosaur”
The program will let you know if there are any errors and it will confirm if it finished creating the management pack file.
From here you simply import the management pack and as usual wait a little bit.
Conclusion
Well it is a lot easier to create this input file with the basics we need to be monitoring the custom device. The total input XML file was about 60 lines if we take away the empty lines. The resulting management pack was 690 lines long.
There will be a complete example coming from the product team very soon now, including comments in the file and such. This is just a quick starter to help you play with this feature.
This is meant to get NOT Certified devices in a more complete monitoring state as if it were CERTIFIED. As you have seen the device types and component types are for the moment a limited set.
My idea around this feature is that the possibilities might still expand in due time to be more and more flexible. Also it would be nice to see a graphic interface to build up the input XML and of course that would immediately build up the management pack. However those kind of things take a lot of time to build. I consider the current solution a nice go between.
Back to the SCOM 2016 Features – Overview post!
Hope you all have fun!
Bob Cornelissen