As stated in the previous post, there was a SCOM CEP meeting last week which I wanted to discuss as I am enthusiastic about the CEP program and even more about the upcoming product and its possibilities. So lets continue with what Justin Incarnato discussed as new features and my personal opinion on those. Some of these will be more extensively blogged by several in the SCOM community and I will do so too.
So whats new:
RMS removal and resource pooling, application platform monitoring (APM, previous Avicode), network device monitoring, dashboards and visualization, Linux and Unix support additions, JEE monitoring support. All of this while preserving existing investments in ACS, AEM, notifications, reports, management packs and so on.
Lets split these up’and discuss them a bit further:
The specific RMS role has been removed, although there is still an RMS emulator to provide a point of access for certain functions. The SPOF RMS role was always a difficult one as many times it had some problems with services stopping or something else going wrong that simply stopped monitoring or access to monitoring consoles. Also clustering this role and also running updates on a clustered RMS proved to be difficult at best before. Workflows can now be assigned to a resource pool. This is to provide high availability to cross platform and network device monitoring which was not there before. Workflows can now
be ponted towards a resource pool of management servers and these will be spread throughout the pool members. For backwards compatibility there is still a RMS Emulator (RMS-E) role, which is basically by default the first management server installed. Anything that must target the RMS can be targetted at the RMS Emulator now. You can see which one is the RMS-E by checking the administration pane for management servers, one of the colums will show the emulator.
Personal note from Bob -> In many cases we have run into problems in monitoring crossplat and network devices in a multi-management server scenario, where the windows agents failed over to another MS and the crossplat/network devices just stopped being monitored. Adding these possibilities to cover single point of failure and also to cover possibilities to spread the load is great.
For cross-plat agents deployment it is best to FIRST create the resource pool that will handle these agents as it is difficult to change this later. For network device monitoring the resource pool assignment can be easily changed at a later stage. Justin showed how to make a resource pool and add at least two management servers to it for it to be highly available.
Network monitoring was quite basic and not very stable at first in the 2007 version and needed third party add-ons in order to monitor the network layer. EMC smarts technology is now built into the product. This adds a lot more depth without the need for third party add-ons. We will be able to visualize physical links as well, so what Windows Server is linked to what port on a switch and create a nice visual dashboard from this.
Note from Bob -> this might be one of the most requested features to be expanded in SCOM. I have been partnering with several third party software vendors that offer very good products and packs to cover these (also community packs by the way). But to be honest it is better if the product itself has more possibilities and also the combination of getting it visualized!
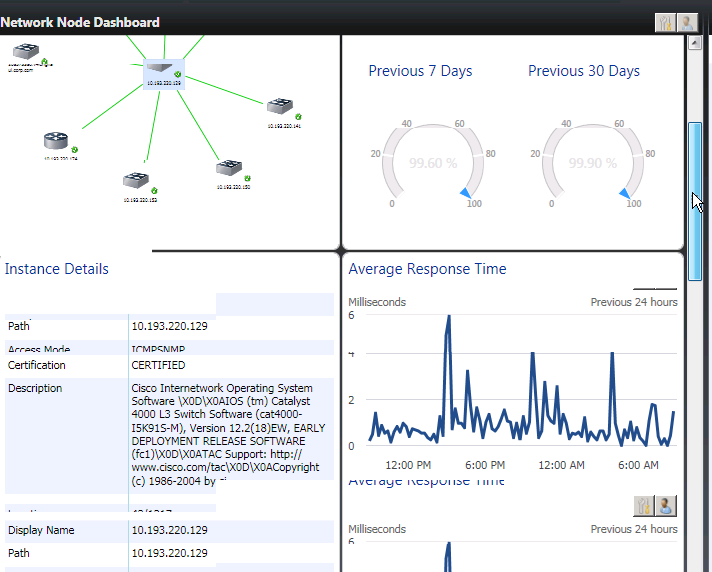
So because of this new EMC Smarts technology we have a broad coverage of supported devices, this includes SNMP v1/2/3 support and ipv4 and ipv6 support. Reporting is expanded into much requested statistics by network admins. There is a discovery of the physical network layer in order to find which device is connected to which other device. This can be between network devices, but also be expanded to the Windows machines connected to them. They are still working on the cross plat physical layer discovery and they will include it in a later stage (they hope before RTM). This generates a very nice vicinity dashboard which can display network diagrams of connected devices. In all it is said to be a robust platform for partners to build on.
Note from Bob-> this one was highly requested by customers! Not only device support and monitoring, but also reporting and visual dashboards! There have been a lot of investments made in the past by several companies and community members into the network monitoring supportability, reporting and dashboarding, and this includes a lot of this into the main product. Can’t wait to draw a few network diagrams in a second test I am planning with a customer who is willing to get a good number of network devices monitored. Is a bit nicer than a test environment with one device, right?
Alright, lets first get a screenshot of Justin showing off the network feature during the demo:
The next post in this series will continue about whats new in the product (as discussed by Justin Incarnato in the mentioned CEP meeting) and my personal opinion on those.
Previous post in the series
Next post in the series