
This is part 3 of the multiple part series on monitoring a service by using the windows service monitoring template included in SCOM.
To start the links to other parts of the series:
- SCOM – Monitoring a Service – Part 1 intro
- SCOM – Monitoring a Service – Part 2 basic service monitor
- SCOM – Monitoring a Service – Part 3 service monitor template
- SCOM – Monitoring a Service – Part 4 basic app mp
- SCOM – Monitoring a Service – Part 5 unix/linux service
- SCOM – Monitoring a Service – Part 6 Other options
In this part we will create a windows service monitor using the windows service monitoring template included in the SCOM console. We will create a new management pack to hold the service monitor and we will add the service monitor using the template and discuss options to not only send alerts when the service is not running, but also how to include monitoring the same service for memory and processor usage. This is very easy and the product team has done a good job at this.
So lets get cracking at this one.
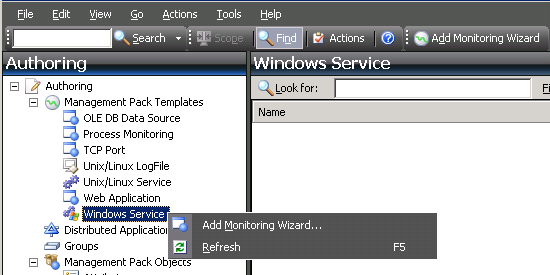
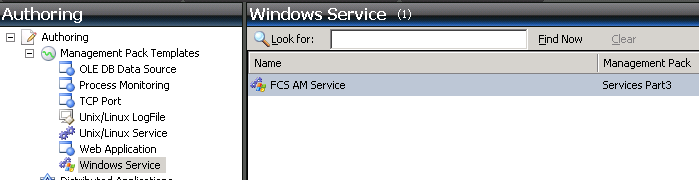
Open the SCOM console. Go to the Authoring pane. Expand Management Pack Templates. Slect Windows Service. RIght-click and slect Add Monitoring Wizard (or use the button in the menu above).
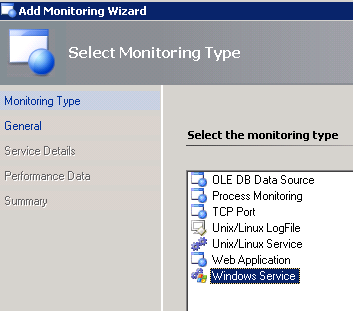
Select Windows Service and click Next.
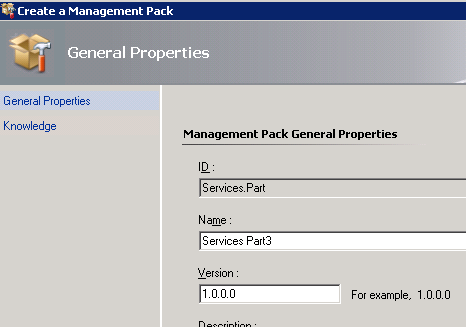
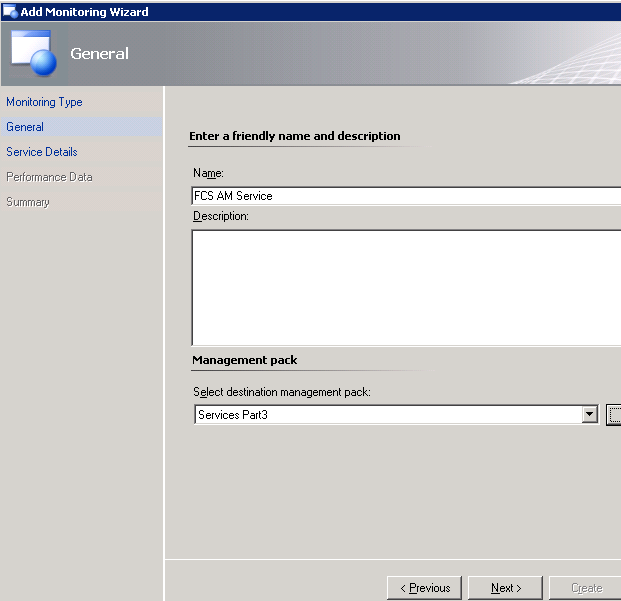
Give it a name. In my case I just used “FCS AM Service”. I left the description open. Now pay special attention… We need to create a New management pack here. So we click the New button. So first click the New button and give the new management pack a name. In my case “Services Part3” and i left the rest alone and clicked Next and Create.
This gives us the following result so far. And click next to continue of course.
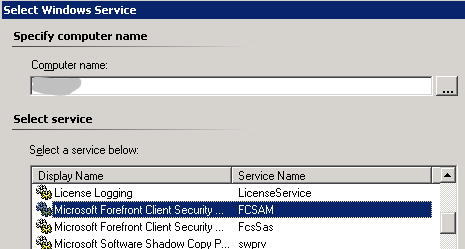
In the Service Details screen we need to define some stuff. First of all the Service name. In this case I use the small button with the three dots to browse to a machine that is running this service and I select the service, like so:
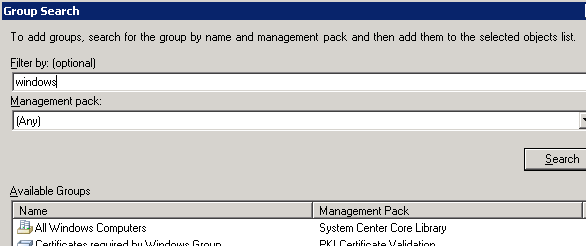
Now we select the targetted group. Use the button with the dots again. This filter is a bit different fm the one in blogpost part 2. I will select All Windows Computers here.
And that gives the following result:
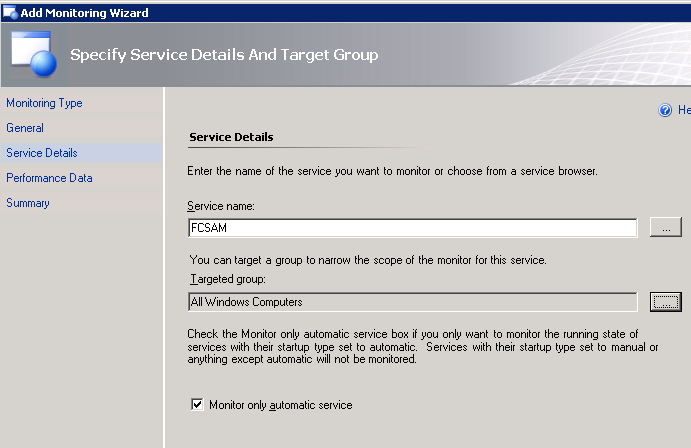
The additional checkbox is also a nice one. When it is selected it will only complain when this service is stopped when the service startup is set to automatic. On to the next step.
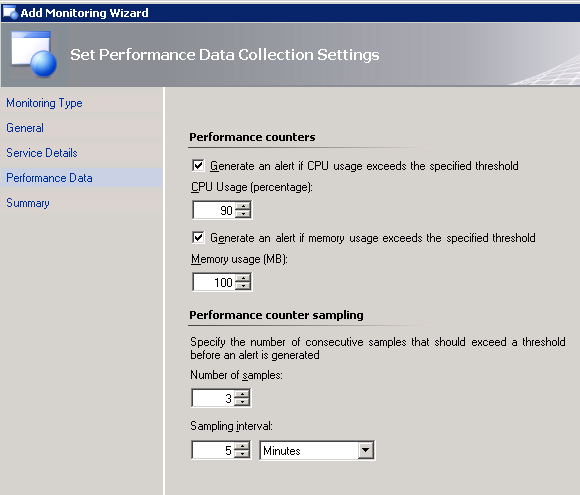
In this screen you can elect to monitor CPU usage and memory usage of the monitored service. For instance use the checkboxes to enable both and set thresholds to lets say 90% cpu and 500 MB memory for this process. We can define how many samples it has to be above threshold and how much time is between each sample.
Insert here: I forgot for a moment that the wizard refuses to enter anything more than 100 MB memory usage. This is a bug in the system (probably it thinks these are percent entries 🙂 ). If you want to change it to higher values you will have to edit this value. I will tell you near the end of this post where. Put it at 100 MB for now.
See following screenshot for an example.
Click Next and Create to finish this wizard.
So what happens when we stop the monitored service…
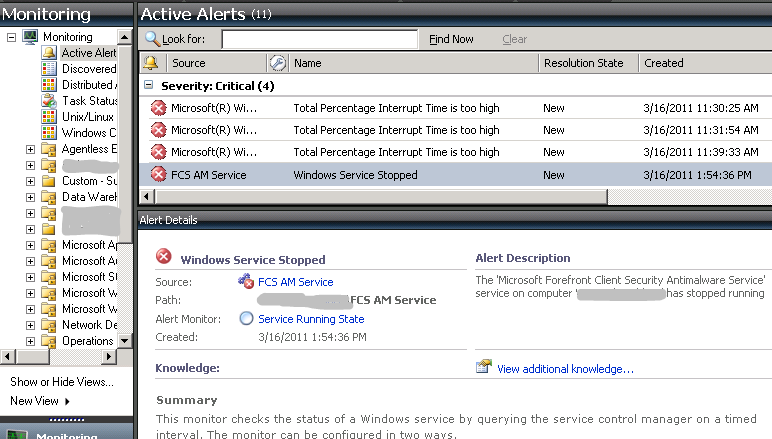
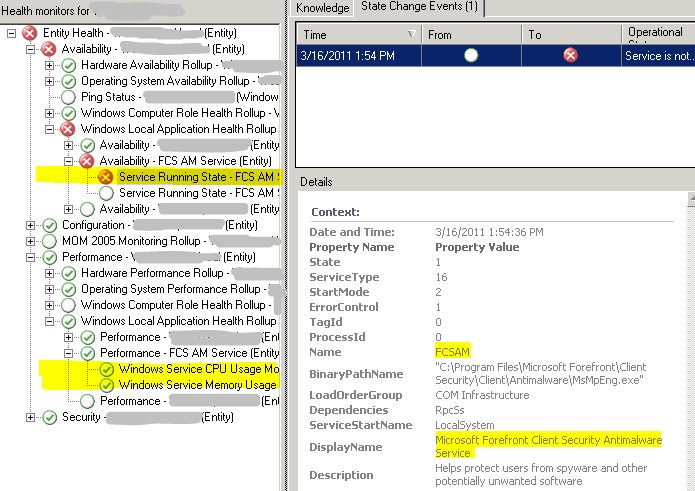
and the health state has both service availability entries and performance entries (sorry for having to hide the computer name entries):
And near the bottom of the knowledge there is a link to start the service. And that (or starting it manually) makes the alert and health state go away and go green again.
So, earlier on I told you that it has a problem accepting values above 100 MB memory usage in the wizard. In the case of the specific service I am monitoring values of 100-200 MB are still normal, so I want to change it to 300 MB for instance as threshold.
So in the last screenshot above you will see I marked a few parts in yellow. You will want to go to the one near the bottom for Memory Usage. In the health explorer of any server just scroll down into the tree to Entity Health – Performance – Windows Local Application – Performance FCS AM Service – Windows Service Memory Usage. Right-click it and select Monitor Properties. Go to the Configuration tab. Here you will see the following:
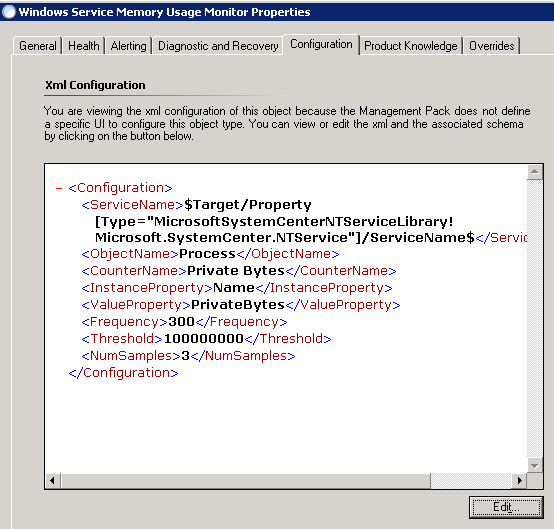
In this screen you can see the threshold in bytes set at 100000000 (so 100 MB ). If you click the Edit button near the bottom of the screen you get into this xml code and you can change this to 300000000 for instance to set it at 300 MB. and Click OK and Apply.
Of course it is also possible to use overrides to change the threshold.
So this is a very easy way to create a service monitor that has a bit more intelligence in it. Could be that we used less steps than in part 2 of this series. And it created a number of monitors in the background for its functions (service running state, cpu usage, memory usage) and alerts. The product team has done a very nice job at this (except for allowing something above 100 MB for memory monitoring wink wink).
The methods used in part 2 and part 3 of this series were very simple and quick ways.
What I propose to do next in part 4 is to go a bit deeper and start monitoring an application. So what we will do is create a discovery, a group, a service monitor, rollup monitor, alerts, a view. This will create both a framework for us to place more service monitors in the same application, target the service monitors (and also rules if we make some) to only machines that are actually running this application and have a look at the machines running it and their state. And we will do all of this from the standard SCOM console. So no Authoring console or XML editting.
Bob Cornelissen